* But didn’t know who to ask
OK silly pun aside….the City of Charlotte has a really cool Quality of Life Dashboard (interactive website) that profiles 80 Charlotte quality of life statistics for 464 Neighborhood areas…here is some info from the website.
Summary
Welcome to the 2012 Charlotte-Mecklenburg Quality of Life Study, a collection of social, crime, physical, economic and environmental conditions that provide a snapshot of the health of our neighborhoods. The study is commonly used by residents, service providers, government agencies, real estate agents, and universities to help understand the dynamics of our neighborhoods. The study data also helps organizations develop programs and determine service delivery strategies to Charlotte-Mecklenburg residents.
Enhancements
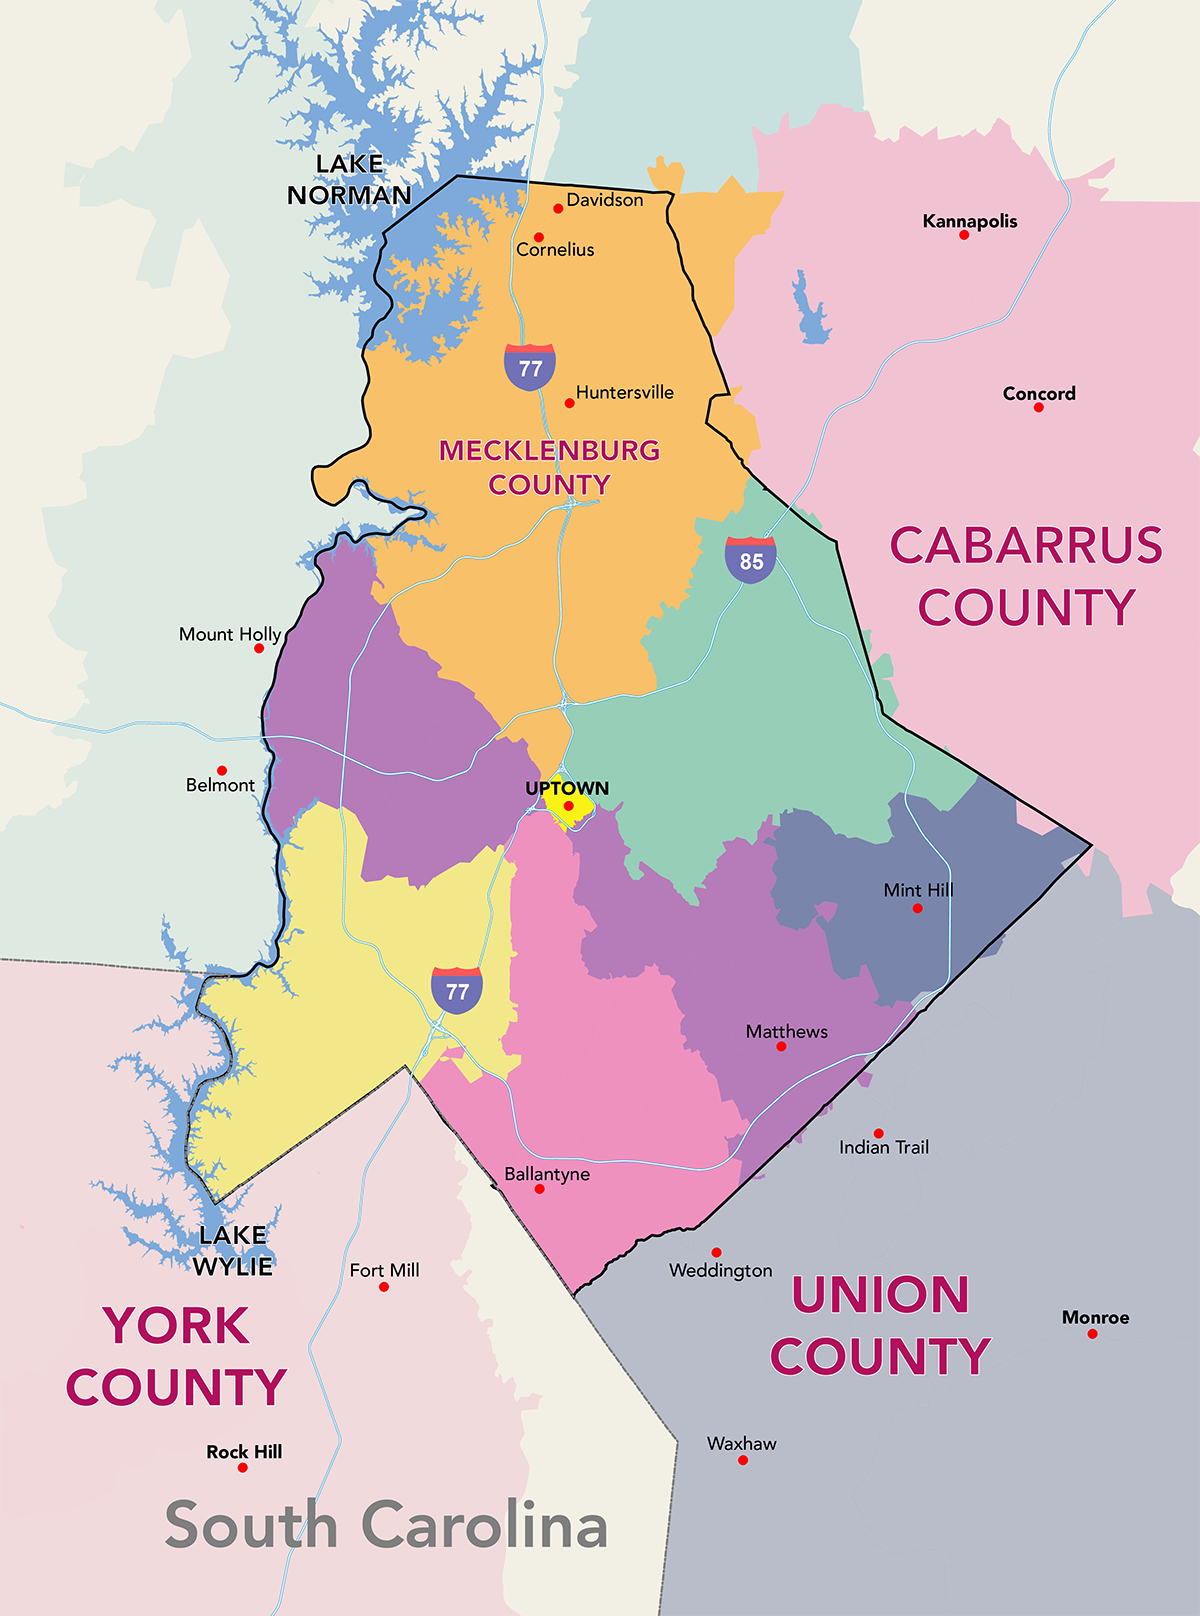
Between 2003 and 2010, the study included neighborhoods within the City of Charlotte geography. In 2012, the study geography was expanded to include the Towns of Cornelius, Davidson, Huntersville, Matthews, Mint Hill, and Pineville through a collaborative effort with Mecklenburg County. The following table highlights the major enhancements for 2012:
There’s a short Charlotte Quality of Life Dashboard tutorial video here…http://www.youtube.com/watch?v=q44rj2M8NKc
Note the report is broken down into 464 Neighborhood Profile Areas (NPA) some of the areas cover several neighborhoods while some like Montibello (are 375) actually represent the neighborhood (we have a 22 page PDF report on Montibello – email us for a copy email Rhonda Gibbons
Some interesting Montibello Quality of Life statistics:
995 Area (in acres)
2,481 residents, 41 Median Age of Residents
3.5% Change in Montibello Residential Property Value
43.9% Montibello Children Attending Private Schools
94.6% CMS 6-8 Graders Proficient in EOG (CMS end of grade) Tests
84.8% CMS Students Attending Neighborhood Schools
99.9% Registered Voters WE VOTE!